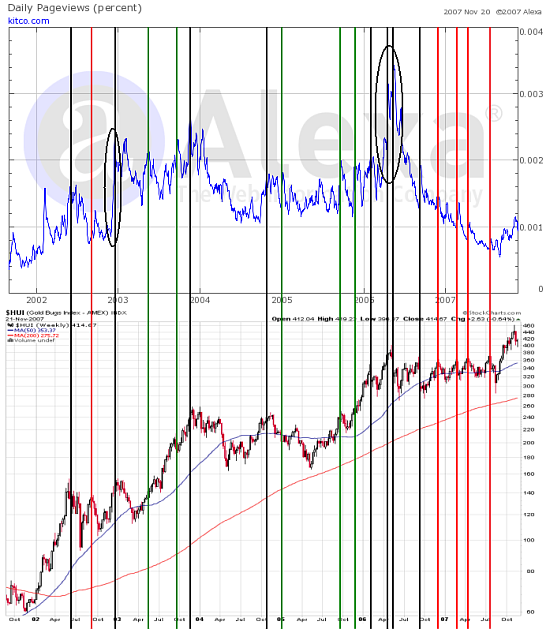
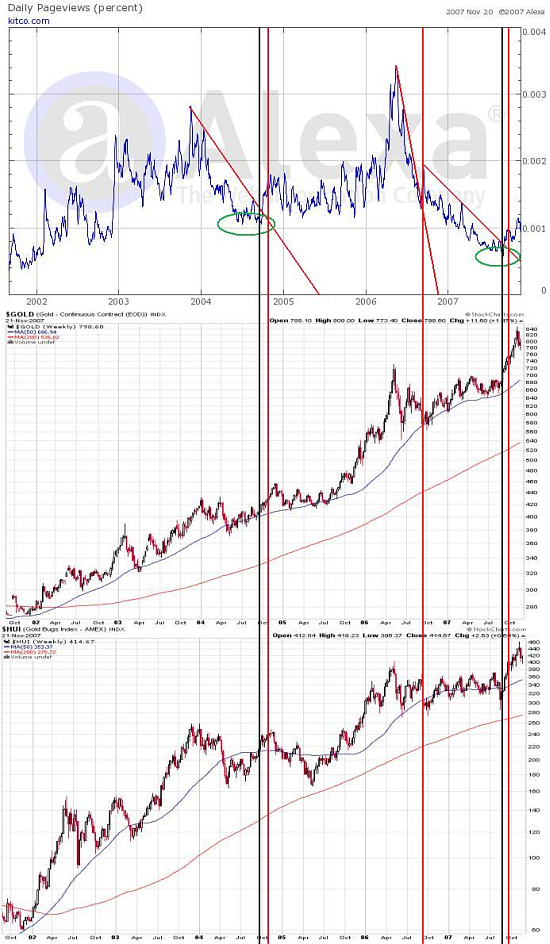
We all know that supply and demand fundamentals decide where the market is going in the long term. This applies to all markets including currencies, bonds, stocks and precious metals. However in the short term emotions, not fundamentals control the market. With exception of computer-based trading systems it is ultimately someone (be it individual investor or a financial institution) making the decision about buying or selling. We, humans, tend to be more or less emotional whether we like it or not. It is nothing wrong most of the time, on the contrary – for example without feeling fear people would perform dangerous activities without hesitation, often resulting in injuries. In trading, however, it is usually best to focus on the emotions of other market participants, while ignoring trader’s own feelings. Fortunately we live in the information age and we have various tools to measure the sentiment – emotions of speculators and investors on. One tool, that is not commonly used , is analysis of traffic on specific investment-related websites. Nowadays internet is usually the first source of information. Therefore in order to find out how much people is interested in a specific topic, one could check the popularity of websites that provide information about it. When it comes to precious metals, the most known and commonly used and therefore the most representative site is www.kitco.com.
The object of this essay is to help investors and speculators analyze and profit on information provided by Alexa about www.kitco.com.
If you didn’t check out this website yet, please do so now. Alexa shows graphs regarding daily reach, rank and number of page views. The reader might ask him/herself “which one should I use?” The answer is quite simple – the one that works! Graphs are similar but not identical, so each of these series of data will be compared with the price of gold and checked for possible relations. Alexa provides a little more than six years of data, so subject of this analysis is the period 2002-2007. We have sometimes used a few signals per one ‘rise’, which may seem a bit awkward. Please note that it is easy to say, when a particular upswing ended, with the benefit of hindsight. Traders, speculators and investors don’t have that benefit when they enter or exit a trade. Therefore we need tools that will give us a clear signal WHEN it is needed, which is before or at the moment of forming a top not one month after the top has already formed and prices are low. That is the time to buy – not to sell. Buy low, sell high – remember?
Please note that we have excluded one important observation from our analysis. That is the signal which occurs in every chart analyzed here. That is a rise in Kitco’s web traffic that took place at the beginning of the uptrend (2002), which is precisely the reason it has been excluded in the first place. In other words – that was the time, when both gold and (also analyzed here) HUI index broke out of their downtrends – see charts below:
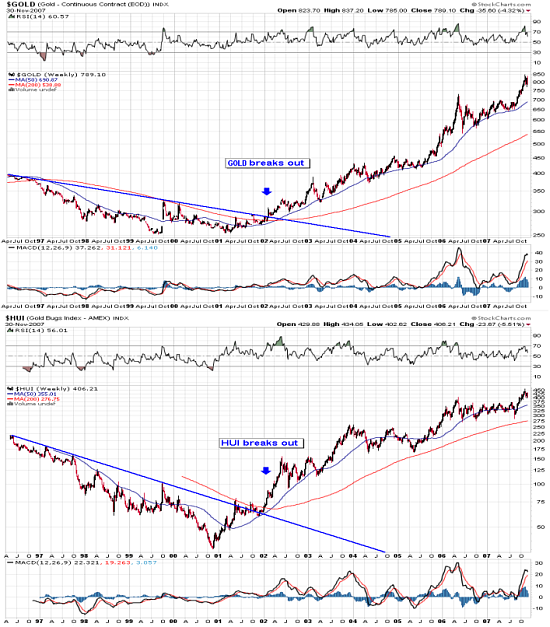
Charts by courtesy of stockcharts.com
Gold and gold stocks breaking out is not something that should be overlooked. It is crucial and one-time event. It has probably influenced Kitco’s traffic, which rose significantly at the time of a breakout, though no top was forming. Since, like stated earlier, such event takes place only one time per bull market, we are far from repeating it. Therefore, when it comes to analyzing Kitco’s web traffic, this rise should be ignored.
In order to fully benefit from this article it is important to understand the methodology we use. Basicly, we decided to analyze these charts in two ways. First, we try to find out whether a particular signal from Alexa’s tools was indeed followed by a sell-off in gold. If we get let’s say 90% accuracy that will mean that if we see the signal, we have very high probability that we will have a sell-off in no time. Sounds like a marvelous, right? Well, that’s only half of the story. For example, if you got a tool that gives you signals of a top each and every day, it would have accuracy 100%, as no day (top or not) would be without a signal. This makes such a tool completely useless, as you would be unable to make a purchase, while expecting a sell-off each day. Besides, if you don’t get a signal that does NOT mean that the top will not materialize.
This is why we also study how much tops was actually preceded by a signal. Accuracy of 90% would mean that a vast majority of tops was heralded by a signal. This means that if a price has been rising for some time and you expect a top, but there is no signal, most likely that’s not it.
Of course it would be ideal to find a tool that is highly accurate in both mentioned ways. Unfortunately, often that is not the case, thus it is important to understand above mentioned distinctions and use this knowledge to gain advantage over traders, who are not so detail-oriented.
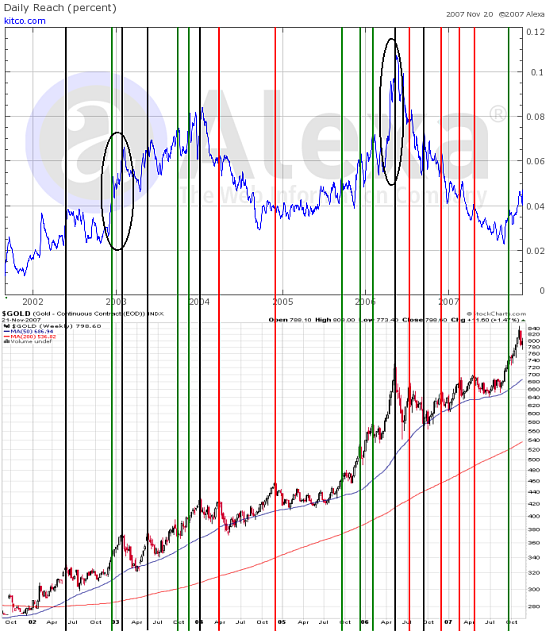
After we gave our background of the analysis, it’s time to see what use of Alexa’s data can we make. Below is the Kitco’s daily reach and the price of gold charts:
Charts by courtesy of stockcharts.com and alexa.com
Chart may seem a little unclear, but including all lines is necessary to come to the right conclusion. It is arguable whether all tops and rises in interest marked on the charts are relevant, but please note that it is better to have more data and then to narrow the range, than to have little data in the first place.
Green and black lines represent what one would assume to lead to sell-offs – rapid rises in daily reach. Suddenly gold price becomes followed by more people, of which some are new to this market. A lot of these people are momentum players and/or so-called ‘weak hands’. People become over-optimistic in the short term and there comes a moment when everyone, who was interested in gold, is already in the market. Without new buyers, price starts to fall. “Weak hands” fear losing their capital and sell – the price falls further.
Red and black lines represent the local tops in the price of gold, which one could expect to be preceded by rather large rapid rises in Kitco’s daily reach.
Black lines mean that particular top was signaled by rise in Kitco’s daily reach. Green lines mean that the signal was false (rise in interest but no sell-off) and the red lines are the ones where top was not signaled by daily reach.
Please note that the the price topped on February 2003 – daily reach gave two signals. Second signal was accurate, whereas the first one was about 1,5 month too early. It is not a clear signal, but it sure did warn about lower prices ahead. Indeed, price of gold was lower 3 months later after signal occurred. Therefore that signal was definitely not worthless, but we will still stick to our original method of analysis, meaning that this signal was not directly followed by price decline, so we will consider it to be false.
Well, in case of gold, the results on this analysis are far from amazing – only 6 out of 13 signals predicted decline in prices on a considerable scale and only 6 out of 12 tops were heralded by rise in Kitco’s daily reach. It’s about 50-50 situation, in both cases, which makes usefulness of this tool rather limited.
Effectiveness can be improved when one chooses to pay attention only to the big upswings in Kitco’s web traffic. They are marked on the chart with black ellipses . There were only two times such big moves took place. Please note that when this signal is to occur, at first you don’t know whether that signal is really the beginning of a big one, or is that the of a middle-sized rally. This means that you have to wait until particular rise is really huge. Paying attention to big moves will not give you signals to each and every top in gold, but when such a move does materialize, depending on your investing style, you should very seriously consider selling part or all of your portfolio, hedging or even shorting the market to some extent.
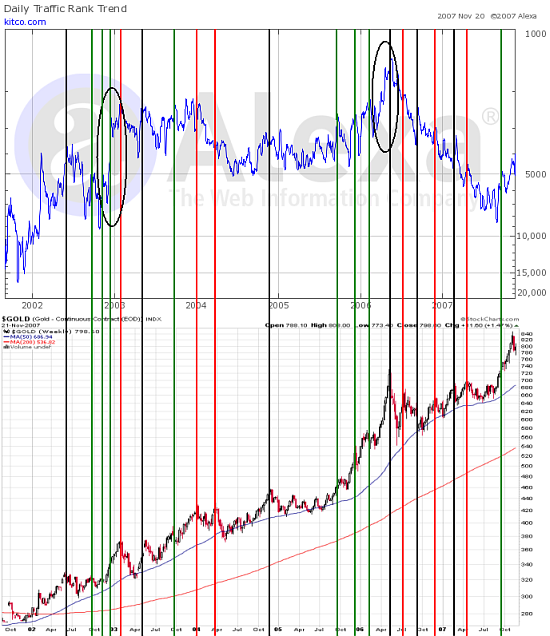
Measuring sentiment with rank and number of page views gives us similar results.
Charts by courtesy of stockcharts.com and alexa.com
Using previous methodology – only 6 out of 14 signals predicted decline in prices on a considerable scale and only 6 out of 12 tops were heralded by rise in Kitco’s rank. Results are comparable to those of Kitco’s daily reach, only this time there were 2 more false signals. Not really impressive. Again, if you paid attention only to the big moves, you would have predicted two tops without making any false calls.
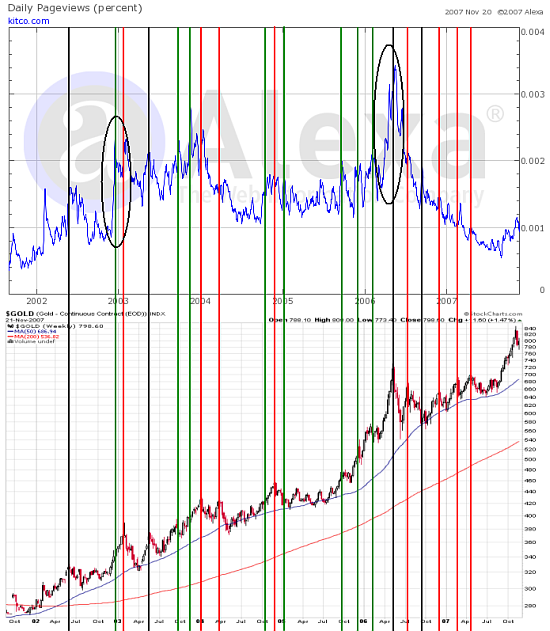
Our last chart from Alexa presents number of Kitco’s page views:
Charts by courtesy of stockcharts.com and alexa.com
One can argue whether the February 2003 top was indeed signaled or not, but even if this one qualifies, that does not change the overall results.
Only 4 out of 12 signals predicted decline in prices on a considerable scale and only 4 out of 12 tops were heralded by rise in Kitco’s page views. Again nothing to call home about. Nonetheless this chart can be analyzed together with other two tools provided by Alexa, in order to detect rapid rise in Kitco’s web traffic on a large scale. Small signals vary from one chart to other, but these huge upswings are present in all of them.
Conclusion:
An increace in web traffic for www.kitco.com is definitely not NEEDED for a top to form – in fact, half or most of them were not signaled by these tools.
Signals are often too early to trade them directly. Increased web traffic says only “watch out”, but it does not precise when exactly the top will form. Please note that some large tops such as the one on May 2006, were indicated by all 3 tools provided by Alexa. Perhaps this tools can be implemented with much greater success if they are used to predict price declines of rather large magnitude after big upswings. At the moment of writing this article (November 27-th 2007) data seems to confirms this theory, but we certainly need more of it to either definitely confirm or reject this theory. Right now, in our opinion, it is highly probable that any sizeable top in the future will be indicated by Kitco’s web traffic.
Ultimate reasons as to why this relation between web traffic of an investment related website and price of gold does not work with exact precision are unknown and may vary from one the top to other. Nonetheless we will give you our thoughts on that subject.
Precious metals market is not limited to individual investors, on the contrary – large speculators and bullion banks make a large part of it. Just take a look on the amount of open interest on the COT report attributed to commercials and non-commercials and then compare it to the ‘little guys’ – non-reportable positions. Big players (in case of gold, you can also put central banks and IMF into this category), although there is not necessarily much of them, command big amount of capital. Technical analysis (TA), which measuring sentiment is a part of, can be less valuable, when single transactions have considerable impact on the market. Unfortunately, for anyone using TA, that is the case with precious metals market. Even if investment-fund managers and other professionals look at www.kitco.com, there is not that much of them to make a large difference on Alexa charts.
Another reason for little efficiency of analyzed tools could be that significant part of demand for precious metals comes from people from abroad, who do not necessarily speak English. These people obviously do not use www.kitco.com, as all information on this website is written in English.
In order to use information provided by Alexa, we would need to have a market, which attracts more ‘little guys’ percentage-wise and investors who can speak English. While buying gold or silver can be done quite easily without using English, purchasing gold or silver stocks is rather difficult. First of all, you need to do research about specific companies. Second you have to open a brokerage account. Investors in some countries have limited or no access to opening an account, which allows them to invest in foreign equities (even if it is possible, such accounts often involve high fees, for example - in Poland), so they are likely to open an account abroad. In order to do that people usually need to communicate in English, thus brokerage accounts, through which one can buy precious metals stocks are usually owned by English-speaking investors. Countries, where people can purchase foreign stocks, while paying reasonable fees, are generally those, where people can speak English anyway (for example - Germany).
Unlike physical gold, gold stocks are not owned by central banks and whereas tangible assets are typically bought by most investors for the long term, gold stocks are convenient way to speculate and actively trade the gold price. Apart from that, it really does make more sense to try to time the precious metals stocks than the metals themselves, since former are more volatile. Like stated earlier in this essay, unlike equities, physical metals are not widely used for speculation. You can see it for yourself on the charts. On the HUI chart we have an apparent distinction between rise and a consolidation, whereas gold’s rise is much more stable – that is from a 5+ years view. In other words: if the stocks get knocked down – they fall hard. Precious metals stocks almost always sell-off, when the underlying metals fall too. Therefore, we have similar chances of a sell-off in both markets and since the fall will be deeper in case of gold stocks, the risk/reward ratio is definitely in favor of selling or ever shorting stocks instead of metals.
Taking all above mentioned facts into account, it seems that precious metals stocks are perfect subject to analyze together with Kitco’s web traffic. Let’s find out.
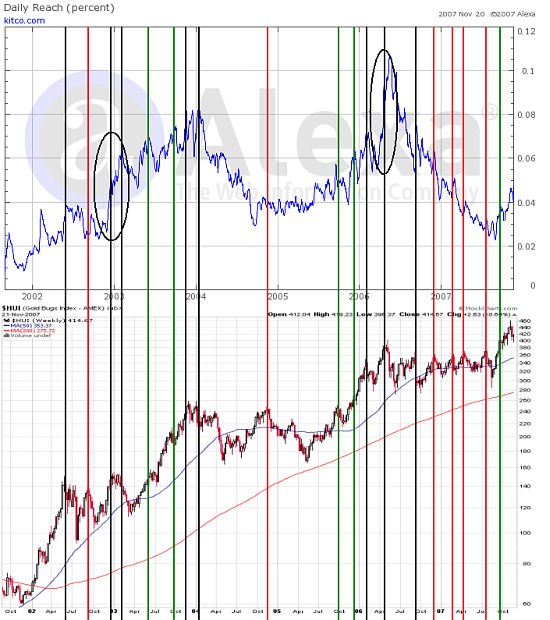
Our first subject of analysis are the charts of HUI index compared to Kitco’s daily reach. As we see it, Kitco’s daily reach is definitely more correlated to the HUI index, than to the price of gold.
Charts by courtesy of stockcharts.com and alexa.com
This time 8 out of 13 signals were correct, two times two signals predicted the same top (in the Jan 2003 and Jan 2004 time frame). Out of 12 tops, 6 were signaled. Signals are still far from being crystal clear but the improvement in efficiency is visible. Still, it makes most sense to pay special attention to big moves in daily reach, after HUI made already significant gains. We expect this relation to be even more useful in the future, as more individual investors get interested in the commodities market.
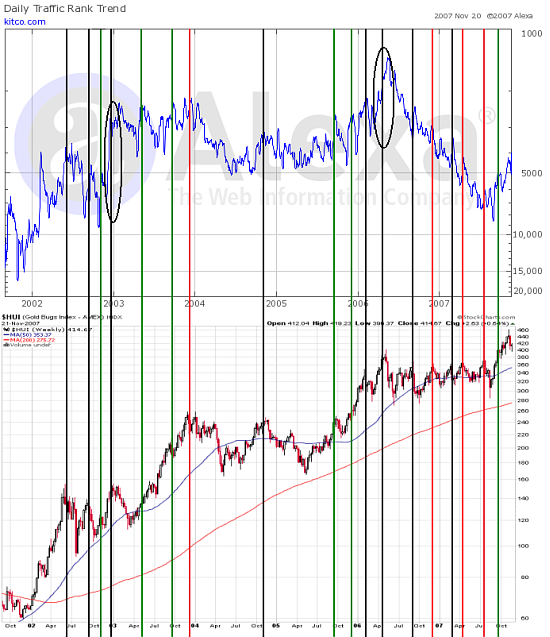
Second analyzed combination of charts is HUI and Kitco’ rank. This tool is a little less accurate, than the previous one, as it gives a few more signals:
Charts by courtesy of stockcharts.com and alexa.com
Kitco’s rank fluctuations have similar strengths, so it is more difficult to differentiate between noise and important moves. More of them are qualified as significant. This time only 8 out of 14 signals were correct and 8 out of 12 tops were signaled. It means that this signal is not really precise, but on the other hand most tops was indeed preceded by a signal.
Last chart presents HUI and Kitco’s daily page views:
