| All Rights Reserved Worldwide | FAQ Privacy Policy Terms of Use Disclaimer | Copyright © 2008-2011 by Sunshine Profits |


In our previous essays we have often referred to both linear and nonlinear trend lines when comparing performance of different gold / silver stocks. In this article we would like to explain how one can estimate whether particular stock is under- or overvalued to gold / silver at a given moment.
Several weeks ago we have written an essay dedicated to measuring precious metals stocks’ leverage and exposure to gold. Since then, we have received many e-mails in which our Readers asked us about the difference between particular trend lines. This essay is designed with these questions in mind, but can prove valuable to Readers who are not yet familiar with our work. Should this analysis seem to specific, please refer to the aforementioned article for a broader perspective.
Before we tell you about this method of estimating over- and undervaluation of stocks, we need to emphasize a few issues that are very important in this analysis but are often ignored. First of all, using inappropriate trend lines might cause qualifying some undervalued stocks as overvalued and vice-versa. Choosing specific trend lines is absolutely crucial. You also need to focus on the scale in which data is presented on the chart you are currently using before adding trend lines. For example, choosing logarithmic scale instead of linear causes exponential trend line appear as linear. Without further investigation one might think of such a trend line as normal and sustainable in the long term, which is very rarely the case.
In the charts below we are going to show
you specifically what dangers lie in assuming linearity. We will use actual
data for one of our favorite gold stocks at the moment of writing – Compania de
Minas
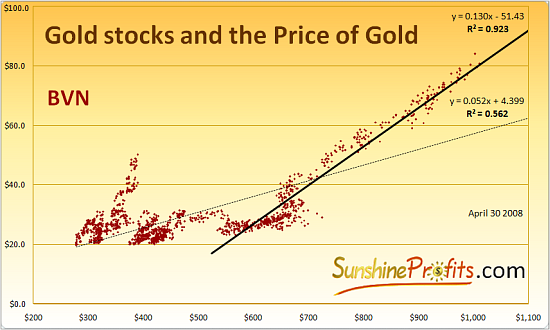
As you may see, we have included two trend lines: one for the whole bull market beginning in January 2002 and one for the second stage of the bull (beginning in January 2006). You can find reasoning behind choosing these dates in our previous essays, so we will not go through this topic here.
Please note that both trend lines and scale on vertical axis are linear. Like we stated a couple of paragraphs earlier, it is very important to keep both of these factors in mind when looking at a chart. Let’s see what happens if we change the scale to logarithmic.
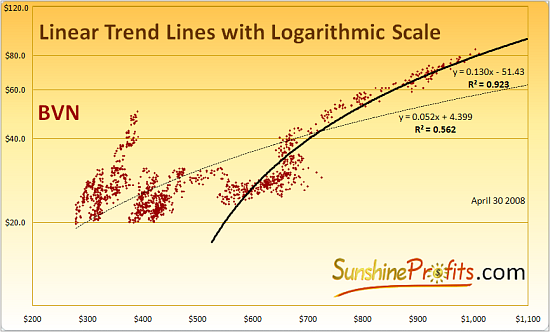
Please take a look at the thick trend line. That’s right – it’s the same linear trend line as before, but this time logarithmic scale makes it seems just like a logarithmic trend line. This scale makes the equal gains (in dollar terms) smaller, as the price increases. This applies to all trend lines, not just the linear one. In fact, if the original trend line was not linear but exponential, the final outcome in the logarithmic scale would be linear. We’ll show you – take a look below:
Exponential trend line in the linear scale:
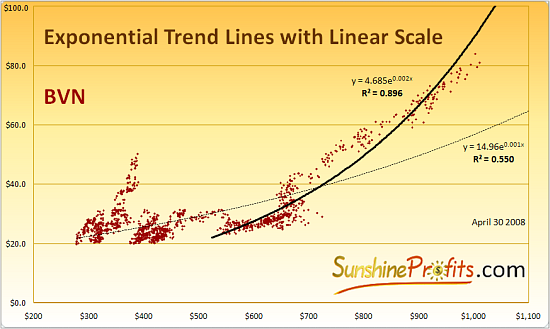
The trend line is getting more and more steep as the leverage increases along with the price of gold. Now, please take a look at identical trend lines in the logarithmic scale:
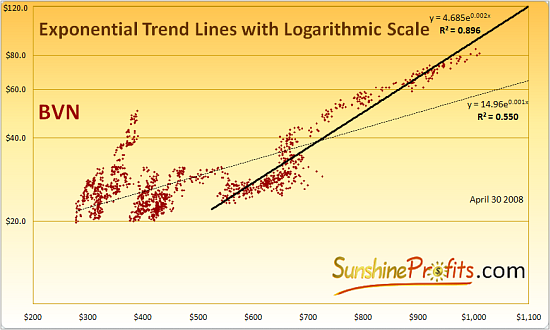
Notice that the exponential trend line takes precisely linear form in this scale. This is nothing extraordinary, as the logarithmic scale is usually used to show stocks appreciation percentage-wise, whereas the exponential trend line means that the growth is constant in percentage terms. Constant growth in percentage terms shown in the scale that reflects this type of growth naturally takes the form of a straight line.
Although it may not be visible on this chart, this trend line implies rising leverage to gold in percentage terms (percentage move for every 1% of gold price). This is a very strong assumption. In our previous essays we have chosen trend lines for many gold and silver stocks and only two of them were best represented by exponential trend line. Was it not enough to prove that this assumption is not generally fulfilled, we might add that even for these particular stocks, the R-square and the leverage were both minimal. This means that this type of trend line was not necessarily very useful. Therefore, you should be extremely careful when it appears that a particular stock seems to react to the price of gold/silver in this particular way.
With this background we would like to tell you a simple way of recognizing whether specific gold / silver stocks are under- or overvalued at a particular moment. First, let’s think why we use trend lines at all. Instead of seeing a full chart with all data, we prefer to know the mathematical equation that would give us a sense of order in these volatile markets. Watching precious metals and equities on daily basis may cause you lose your perspective and begin to act emotionally with your money. This is really dangerous. There are really very few emotional traders who can be successful in the long term – at least the author of this essay has never met one personally. Thanks to using trend lines we might separate our analysis from our emotions. If we agree that the trend in a particular stock is best reflected by a specific trend line, we might view this line as the set of prices that this stock would have without any emotional factors. That would imply that if stock trades currently below its trend line, it might be consider undervalued, as fear makes some investors sell their positions prematurely. Of course, similar analysis applies when stock trades above its respective trend line. Excessive optimism causes investors to buy stocks even at very high prices. Therefore, if we see a gold stock trading above its trend line that means that it is currently overvalued to gold. One strategy is to sell it and use the proceeds to buy the metal itself. Of course, you may use this information as you wish and apply any other strategy, for example, selling the stock and waiting for a pull-back to purchase it once again. Below we present chart with illustration of this analysis.
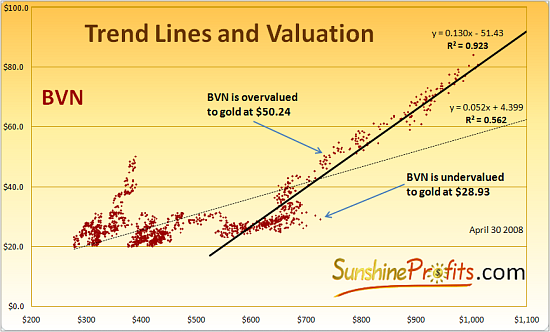
We have chosen two situations, one when
As you see, choosing appropriate trend lines is of fundamental meaning to this analysis, as it decides whether we will qualify particular price as under- or overvalued. We must, therefore, pay special attention to choosing best trend lines before we begin our analysis. Please, take a look at what would be the implications of not paying enough attention to this matter.
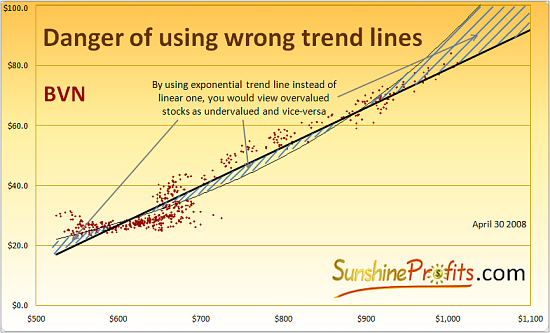
The marked area represents combination of gold and stock prices at which you would change your judgment regarding under- or overvaluation, depending on which trend line you would use. For example, with gold at $950 and BVN trading at $80, if you used exponential trend line you would think that fair price for the stock is about $83 and consider this stock as a very attractive buy. Purchasing at this price may, of course, prove profitable, but our analysis suggests that at given conditions, the stock would be overvalued. According to linear trend line, which we find the most appropriate for BVN, this stock’s fair value with gold at $950 is about $70. The higher the gold price would go, the wider the gap between trend lines would get. The higher the price of the underlying metal goes, the bigger mistakes in valuation you would make. This means that as the price of gold advances you are more likely to make wrong evaluation of a particular stock.
The same type of inaccuracies applies also to trend lines presented in the logarithmic scale. Although trend lines might look different, it does not mean that they represent particular stock better or worse. Different scale is just a different way of seeing the same trend line, with all benefits and disadvantages this specific trend line has.
Summing up, it is very important to always use trend lines that best reflect stocks’ performance. R – square might be helpful in determining which one you should use. Even if you do not analyze charts on which stocks are presented with regard to the price of gold, you should keep in mind the influence that the scale has on the shape of particular trend lines.
On our website you can access tools dedicated to evaluating trend lines for most popular gold and silver stocks. Register today and you will gain access to all our Tools and much more. We use the methodology described in this essay as well as many other techniques to forecast market’s moves and discover unique opportunities for profit. When you register, we will send you occasional, brief market alerts, based on our research, whenever situation requires it. Registration is FREE of charge and you may unregister anytime.