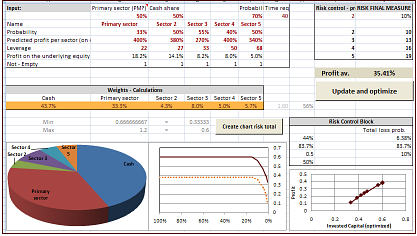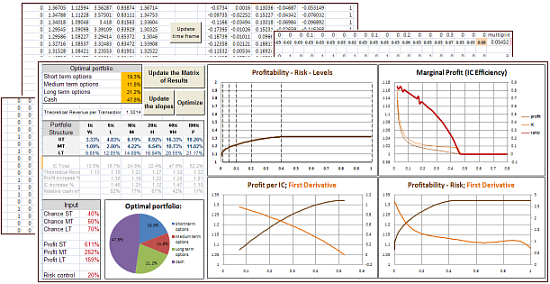
The second model is used optionally, depeding on the fundamental factors. It focuses on determining whether the risk/reward ratio achieved by taking a position in the sector of our primary choice (precious metals in most cases) can be improved thanks to diversifying into other sectors. Why is that important? Please take a look at a simple example below.
Let's consider call options on stock A that trades INDEPENDENTLY from another one (B). You believe that options on both of them have about 60% probability to give you 300% profit in one month. These could be options that expire in the next couple of months. For the sake of this example, we will assume that you can either purchase any of these options or mix them in equal proportions - 50/50.
If you choose to purchase either call options on stock A OR stock B, you have simply 60% of gaining 300% and 40% of losing the capital you put into this transaction.
Now let's see what happens if you decide to put 50% of capital (dedicated to this transactio) into each of these options.
To simplify, you have four different outcomes:
1) Call options on stock A give you 300% profit and call options on stock B give you 300% profit,
2) Call options on stock A give you 300% profit and call options on stock B expire worthless,
3) Call options on stock A expire worhless and call options on stock B give you 300% profit,
4) Call options on stock A expire worthless and call options on stock B expire worthless.
We will now calculate the profits corresponding to each of the above scenarios.
1) 0.5 (portfolio share) * 400% (how much times your capital would increase) + 0.5 * 400% - 100% = 300%
2) 0.5 * 400% + 0.5 * 0% - 100% = 100%
3) 0.5 * 0% + 0.5 * 400% - 100% = 100%
4) 0.5 * 0% + 0.5 * 0% - 100% = -100%
Now, as for the probabilities of these scenarios:
1) 70% * 70% = 49%
2) 70% * (1 - 70%) = 21%
3) (1 - 70%) * 70% = 21%
4) (1 - 70%) * (1 - 70%) = 9%
Summing up - on average out of total 100 transactions like the one above you would have 49 with 300% profit, 42 with 100% profit and 9 with -100% profit.
We did a test for both scenarios, with and without diversification between the two option types. After 100 transactions the optimal rate of return for single option could be achieved if one invested about 46.7% of one's total speculative capital into this transaction each time. That would imply average (!) gain of 31.5% per transaction.
The optimal share of the total speculative capital dedicated for the scenario with diversification is almost 86%, but even using the previously mentioned 46.7% one would achieve average gain more than twice bigger - that is 70%!
With diversification in mind any other share of speculative capital used to it, bigger than 46.7% and smaller than 86% means risk reduction AND increased profits!
The abovementioned example is not very realistic, as it implies that these stocks are uncorrelated (i.e. move completely independently on average). Usually we have stocks that have some correlation, positive or negative. The chances of achieving gains differ, and so do the predicted profits. And - of course - we normally have more than two stocks/sectors to choose from. That is why created sophisticated algorithms that optimize these shares under those realistics conditions.


