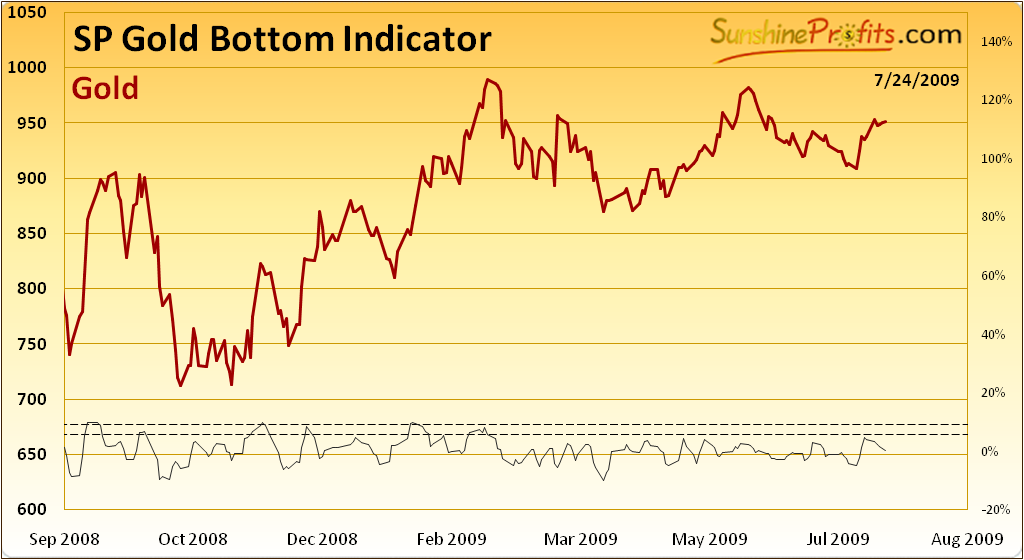
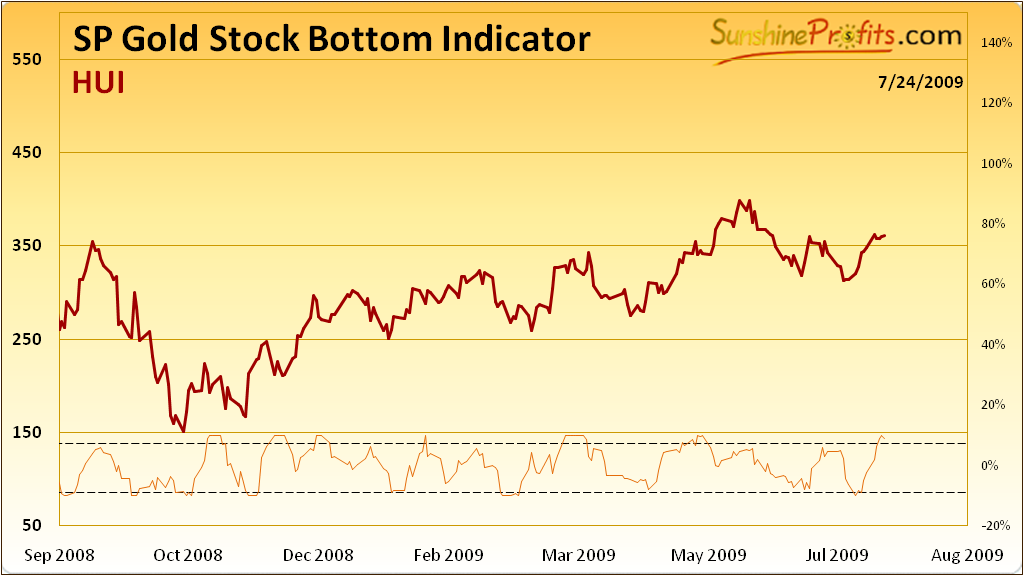
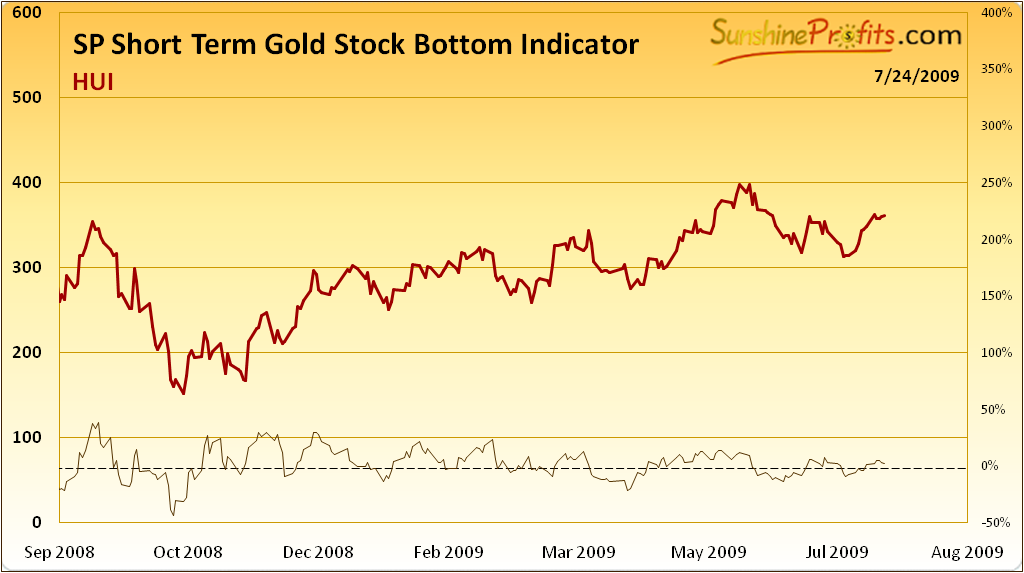
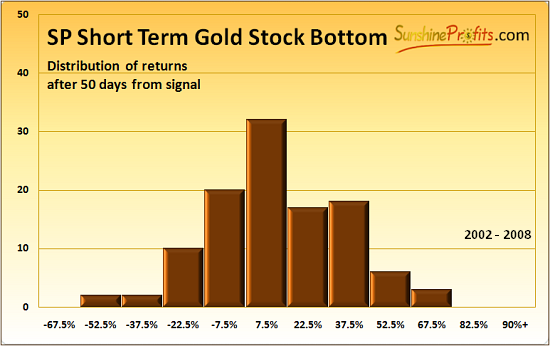
Sample Chart
Daily updates and notifications about signals are available to Members of the Premium Service
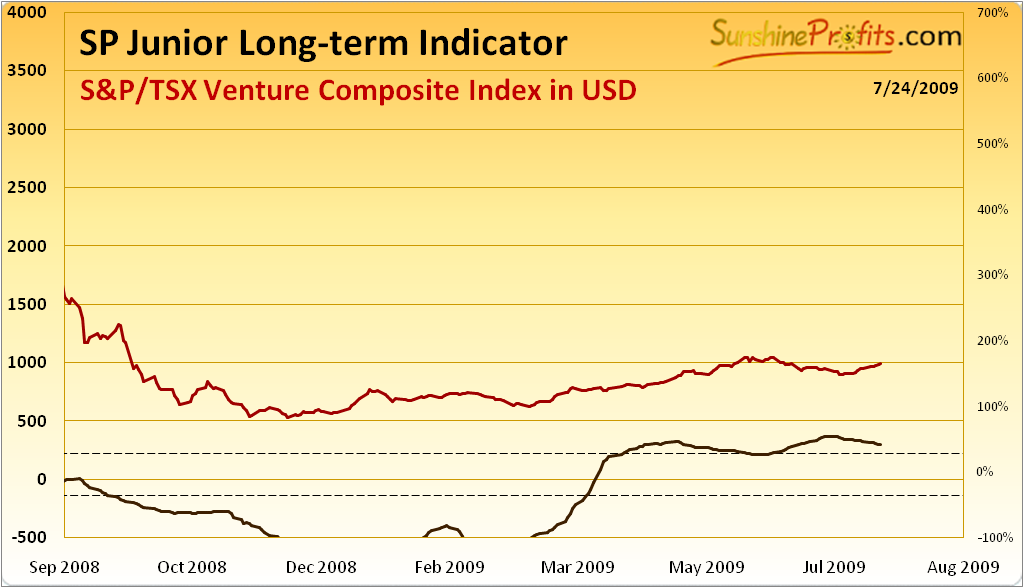
or when it breaks up through the upper dashed line.
This indicator is used in a different way in the long term.
This indicator is used in a different way in the long term.
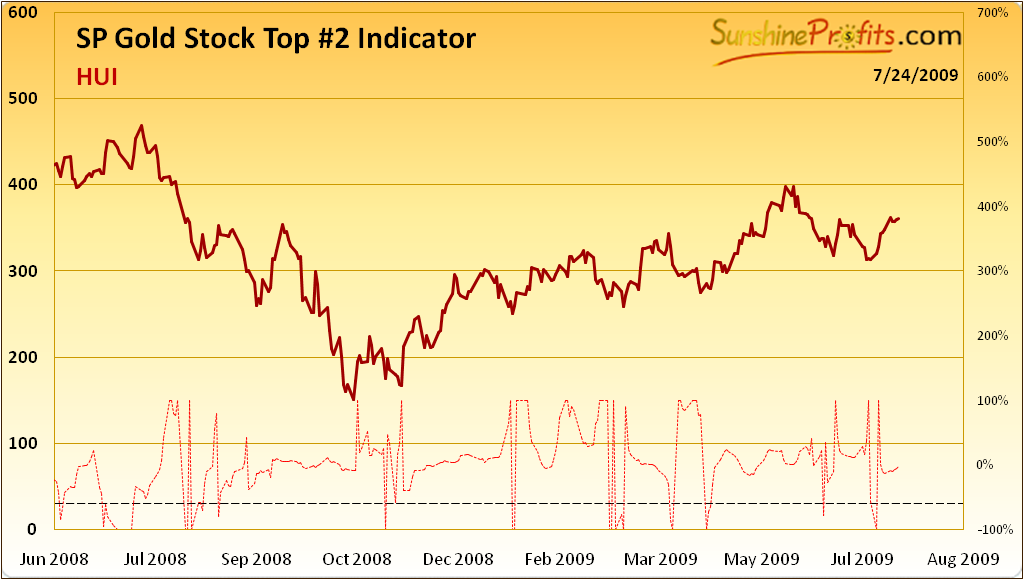
(when value of the indicator has been falling for 3 consecutive days and then the next day is higher)
(the indicator has been falling for 3 consecutive days and rises on the following day).
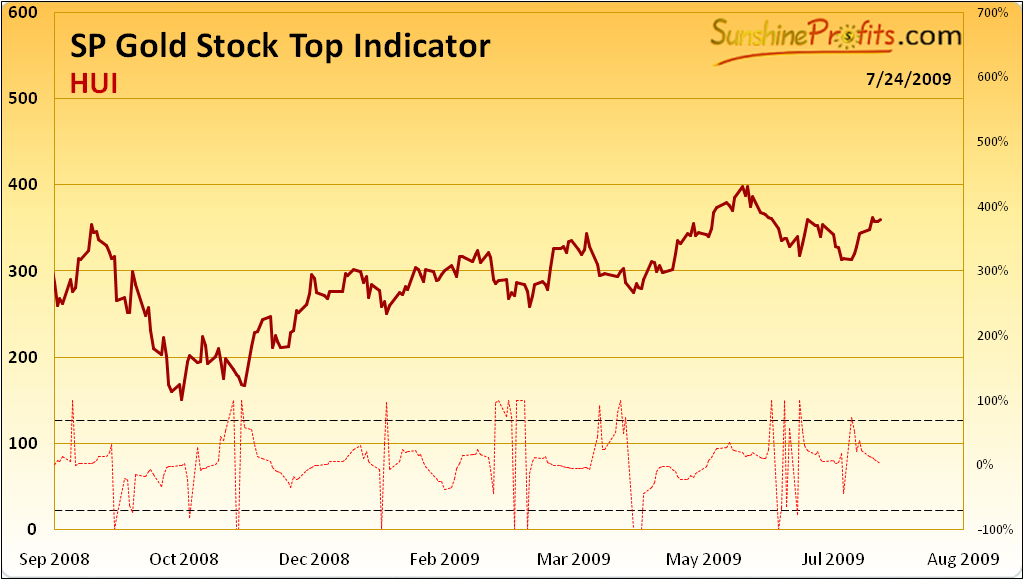
(the indicator has been rising for 3 consecutive days and falls on the following day).
or when it breaks up through the upper dashed line.
This indicator signals extremes, however most of the time these are tops, not bottoms.
This indicator signals extremes, however most of the time these are tops, not bottoms.
Although there are many popular and valuable indicators out there, there are still critical factors that suggest that this may not be enough to make the most of your trading. The first flaw of popular indicators is that... They are popular - they are known by many people, so it's difficult to truly gain an advantage over other market participants by using only these indicators. The second problems is that they were not designed with the precious metals market in mind. If something is supposed to be universal, then it cannot focus on only one market at the same time - and thus it is not on that particular market that was the goal of this indicator's designer. Finally, when you find an indicator that you believe is the best, you will still find that there are times when it simply does not work. That is the case with all indicators, but if you have a whole set of highly valuable indicators, then it will be much easier to spot if one of them gives a false signal.
We have taken the abovementioned factors into account while designing our unique indicators and they are dedicated exclusively to the precious metals market. Generally, we don't want our indicators to be copied, so we don't reveal the logic behind them, but today we will tell you what mechanism is being used in one of the indicators.
The mechanism that we profit on in this indicator is how the institutional investors often act. First of all, institutional investors own a large share of a particular company's shares. It is obvious that they purchase shares that they like, and they don't purchase stocks that they don't like. Institutional investors, contrary to most individual investors, usually have research teams behind them and they must take their opinions into account. These 'teams' or individuals making quantitative valuation of companies would surely (very high probability) take into account several of statistics that we also use while evaluating companies. This implies that companies that top our rankings in terms of particular statistics (R-square for instance) are most likely also the companies most often chosen by institutional investors. So - we can calculate the average performance of several 'institutional' precious metals stocks.
All of the above would be useless if we did not know (expected) something else about how institutional investors react to various market situations. These investors are generally professionals and on average act less emotionally. The key word here is average. On the other hand, institutions usually have loss limits that they need to obey, and also their performance is being compared to other institutions. This means that if they suffer losses, it is not that bad for them, as long as their competitors (benchmark) also suffer these losses. This puts a great pressure on people in charge of the investment institutions to act like their colleagues. If they did the opposite and were correct, they would outperform for a while and perhaps get a bonus at the end of the year. On the other hand, if they are not correct, they may even lose their jobs or worse. Even if the chances are 50/50, the result of being wrong is much more painful, than what they could win, if they were correct. In other words - the expected value of the decision of acting against their collaegues is negative. This makes big money act together, when they finally do begin to sell or buy. These investors are professionals, so they control their emotions most of the time. Most of the time, but not always. If not always, then when? Under the most difficult conditions, which are exactly at the top or at the bottom of the market!
It is no secret that big money sells and buys ahead of the masses, but not everyone realizes how dynamic the process becomes when emotions are mixed with the institutional domino effect. Summing up, institutional investors are rather unemotional most of the time, but at critical times, they act very specifically. They act as if they were very emotional for a very limited period of time.
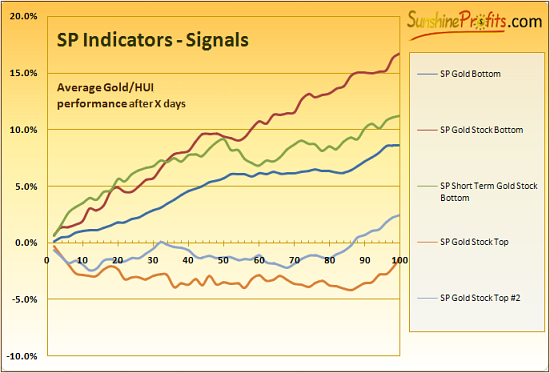
If the abovementioned assumptions are mostly true, then the ratio between 'top' PM stocks and the rest should behave specifically around bottoms and tops. Having investigated this matter, we found that it does indeed take place, but it is more likely to signal a short term weakness, than strength. All that is left to do is to choose the stocks, build a ratio and check its specifics and dynamics. After that, we check at which levels it is most profitable to enter trades and what the average effect will be. Once the testing process is complete we have another indicator for our Subscribers.
![[Most Recent Charts from www.kitco.com]](http://www.kitconet.com/charts/metals/gold/t24_au_en_usoz_4.gif)

![[Most Recent Copper from www.kitco.com]](/files/idx24_copper.gif)
![[Most Recent XAU from www.kitco.com]](/files/idx24_xau_en_2.gif)
![[Most Recent HUI from www.kitco.com]](/files/idx24_hui_en_2.gif)