Juniors – performance and timing
Most gold and silver investors are aware of the fact that junior mining companies involve more leverage to the prices of precious metals than senior, big and liquid stocks. Sometimes investors purchase these small companies hoping that they will make significant discoveries which would cause the share price to soar. However, it is unlikely to happen, so usually the best strategy is to spread out in the sector and sit tight, waiting for stocks’ appreciation. At www.sunshineprofits.com we use junior mining stocks (and respective warrants) both as a long term investment and as a trading vehicle. At times, we even look at their performance in search of specific trading signals. In this essay we will focus on juniors’ performance relative to gold as well as senior mining shares and speculate (as no one can say for sure why a particular sector moves in this way or the other) on the reasoning behind it.
Since financial institutions are usually not able to purchase junior mining stocks, prices of these equities are subject to change primarily due to the activities of individual investors. There are many exceptions from this rule, but generally individual investors, contrary to financial institutions, are not professionals when it comes to investing. Therefore individuals are more likely to make decisions based on emotions rather than econometric models, thorough fundamental analysis and/or advanced technical trading techniques. Institutions usually have many procedures and internal rules that they need to obey, therefore their emotional response to markets’ performance is limited. Individual investors are, on the other hand, most often free to change their investment decisions and remodel their portfolios up to 100% (sometimes even more) each day. This does give a host of opportunities, but also makes these investors more vulnerable to market’s wide swings.
To sum up:
- Juniors are less likely to be held by institutional investors than individuals
- Individual investors tend to depend more on emotions than financial institutions do
One might infer from the above statements that the stock prices of these small junior companies would be highly dependent on the emotional status of the individual precious metals investors. This finding has very important implications.
Firstly, juniors are more volatile than big, senior companies. Emotions cause big upswings to become even bigger, when people get euphoric and buy already overvalued stocks. On the other hand when stocks fall, juniors tend to fall harder as investors panic and dump even already undervalued companies. Bigger swings are therefore to be expected in this sector. This also means that timing entry and exit points is crucial, since it has enormous impact on the overall rate of return.
Secondly, most individual investors are likely to enter the market at the late stage of a particular upleg. Juniors follow seniors on the way up and then on the way down. However this kind of correlation is not crystal clear. Sometimes junior and senior mining companies trade very closely. At times juniors get ahead of themselves and soar virtually regardless of the situation in the most popular precious metals stocks. Finally, there are moments, when juniors seem to ignore the move in the underlying metal and bigger gold stocks and move in a rather lethargic fashion. It is also not uncommon for juniors not to follow big gold stocks immediately during a sell-off. They do fall, but not at the pace that one would expect them to, given their high leverage. They fall further, but not necessarily exactly at the same time as the senior gold stocks.
If we estimated when will juniors respond to changes in the big gold stocks in a given way, we would be able to rebalance our portfolios at the transition point and reap most profits from each type of these securities! Before digging deeper into analysis of this matter, we must choose appropriate proxy for the whole sector of juniors.
We created an index consisting of juniors especially for this essay, but found that it is unrealistic due to the survivorship bias. Since we wanted to show you the way the prices of junior mining stocks shaped during the whole bull market, we could use only those, who were in the business at the beginning of 2002 and still are in it. That means we’ve used better-than-average stocks, as some of these juniors simply go bust and disappear (and not get included in long term indices). Extrapolating prices based on our synthetic index would be biased, as it is easy to tell in hindsight, which stocks performed better. Still, you don’t have that knowledge at the time you decide make a purchase of a particular junior or two. Here, at Sunshine Profits we strive to be precise with our research and detect possible defects before they affect our analysis. This is why we decided to look for different representation of the sector. One company – Endeavour Mining Capital (EDV.TO) got our attention.
This company provides financing to mining companies, which gives it exposure to junior sector. In order to check whether market verifies this or not, we have checked the R–square coefficient for EDV.TO (Endeavour Mining Capital) and an index of juniors, which consisted of 14 gold juniors. We used the data that goes back to the beginning of 2002. Here’s what we found:
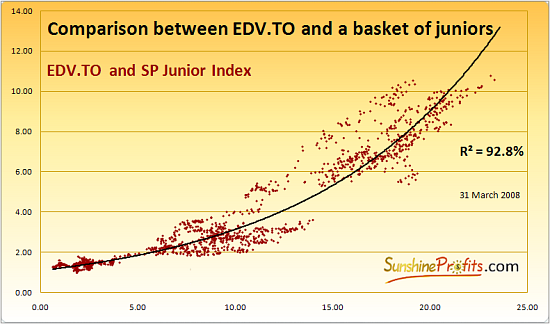
Trend line used for this relation is exponential. The R – square coefficient equals 92.7% Such a high value suggests that we may indeed say that EDV.TO really represents juniors as a sector. The rising, exponential trend line is intriguing – however we found possible reasoning for this phenomenon.
Companies might have entered contracts in which they pledge to sell gold at a price, which was based on past gold prices or which were indexed perhaps on a yearly basis. Costs are not likely to be paid in this way, so companies might temporarily suffer when all commodities (including crude oil) go up. As time goes by, gold price increases and those contracts might be fulfilled economically by more and more companies. Those, which did not manage to achieve the break-even point regarding their gold business have disappeared and those, which did, experienced a windfall of profits. Like stated before our index consists of companies that existed before 2002 and are still in the business.
Endeavour Mining Capital does not have the benefit of the hindsight when it makes investment decisions, so most probably some of the companies, they select, fail. We consider this quite normal as no one can expect any individual or institutional investors to be right each and every time. The end result is that gains of EDV.TO are considerably smaller than those of our index. As the price of gold increases, the chance of junior companies for earning money rises as well. This is more important for juniors, whose situation would become problematic if the price of gold was lower, because of the leverage involved. Since our index consists of companies, which were able to survive when gold was considerably higher, an increase in the price of metal does not have that much influence on their share prices (less leverage). As price of gold gets higher, fewer companies are subject to bankruptcy, therefore EDV.TO is more likely to partially catch up with our index. This translates into rising trend line on the chart above.
Having established EDV.TO as a proxy for juniors, let’s see how this stock performed during the whole bull market with emphasis to its performance relative to the HUI index. The chart below features indexed EDV.TO, HUI and the price of gold (Jan 1st 2002 = 100%).
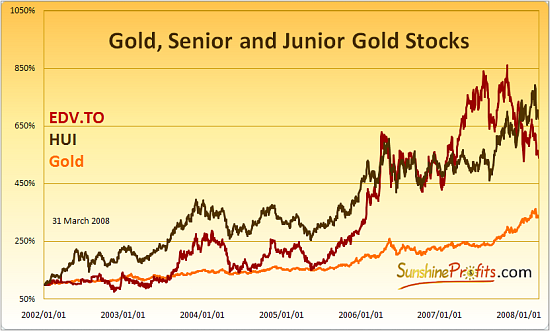
Naturally price of all of the above gold investments has been rising since 2002, despite temporary consolidation periods. Similarity in the shape of each upswing in these assets is a little lower. The performance during each upleg of this bull market is different for gold (which is pretty stable in the its growth from a long term perspective), HUI (where profits are magnified by the leverage the stocks offer) and juniors (usually stable, but catch up with a vengeance at the end of each upleg).
Summing up – the emotions of market participants have bigger influence on juniors than on bigger companies and when juniors start to move, they move fast and far. This sector may be metaphorically compared to the work of a collapsed spring. The fundamentals are one end of the spring. The other end represents emotions. As the fundamentals (for following analysis we will assume that the main fundamental factor is the price of gold) improve, the spring gets more and more collapsed, unless the emotions follow the price of gold. That is mostly – but not always – the case. If the emotions are in tune with the price of gold, the spring does not shrink and in fact does not seem to matter much. However if – for any reason – fear prevails despite improving fundamentals, the spring gets really tight, ready to blast. Unless fundamentals deteriorate, once the fear is removed, we would expect juniors to go ballistic in no time! The longer and the harder this spring gets squeezed, the bigger move will follow. We’ve already established what is the main fundamental factor, but we still need to determine what might cause the excessive fear to take advantage of the above “spring theory”.
Whether one considers the reason for this fear the aversion towards paper investments, concern regarding credit crunch or any other reasons, the end result should be visible not only in the junior stocks market, but should apply to the broad market. Generally, market’s participants often share similar emotions. Of course different sectors have different specific reasoning, but the general tendencies remain the same. In short term it is not uncommon to witness all markets plummet exactly at the same time.
Could it be that the reason for distinctions between senior and junior gold mining shares was in front of our eyes for the whole time? Can we really use general stock market to look for specific signals regarding juniors and senior gold stocks? You don’t have to take our word on that – take a look at the following chart and see for yourself if there indeed is a correlation between EDV.TO to HUI ratio and the general stock market.
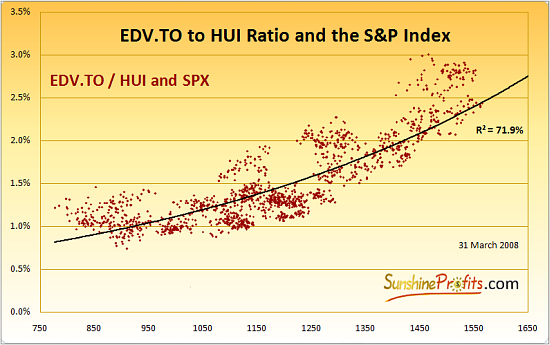
The chart above seems to confirm the initial assumptions. Generally the stock market rises along with the above junior/senior ratio. R – square coefficient of 72% indicates that 72% of the moves in the ratio can be explained by the moves in the general stock market. This can be quite a strong suggestion that our analysis is correct. We might be wrong, as almost all asset classes rise in an inflationary environment (which is the case at the moment of writing this article), and the relation might seem to exist simply because both variables are in an uptrend for their own, different reasons (so called spurious regression). However, we gave our reasoning prior to posting this chart and we are pretty convinced that general stock market really has a major impact on this ratio. On the next featured chart you can see how can this analysis be put into practice.
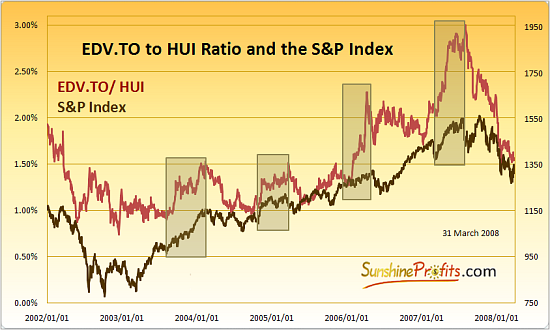
The way we see it, we have had four major situations when juniors vastly outperformed big gold companies. There is a visible upswing in the middle of 2002, but it is a result of a correction in the HUI, rather than the juniors surpassing the seniors on a percentage basis. The trend in the ratio is visibly DOWN, just as the S&P Index at that time. Each rectangle marks the time frame when you would like to hold juniors instead of the big gold companies, or at least switch a part of your portfolio from these senior mining companies to their smaller counterparts. Notice that it never occurred without rising prices in the general stock market. In fact it always took place at the last part of a particular upswing. Why? Because that is exactly when the general public (which consists of individual investors) enters the market! Before a particular market tops we can see signs of redistribution of shares, where smart money, often institutional investors, sell their stocks to people, who enter the market at this point. When this is done, it doesn’t take too much time (depending on the scale of the whole upleg) before the top materialize, as some investors try to secure their profit. Buying power dries up and price begins to fall. Other investors start to panic and they also sell adding more fuel to the fire.
How can you use this information? You are free to use it in any way you find appropriate, of course, at your own responsibility. Here, at www.SunshineProfits.com, we tend to use it in the following ways (depending on various factors):
- Switching a part (or all) of your gold stock portfolio into juniors, when you find that general stock market’s rally is nearing its end
- The same as aforementioned but switching physical gold or silver for juniors
- Keeping your big gold companies and taking a look on juniors to see, when a particular upleg matures (juniors thrive relative to your portfolio of senior mining companies) – improving your chance of selling near the top
- Looking at junior outperformance as a sign of temporary overvaluation in the general stock market – improving your chance of selling near the top
The results of this analysis can also answer the question “why don’t juniors skyrocket yet?”. Well - are we now nearing an end of an upleg in the general stock market? It’s not always easy to tell in which part of the upleg we are (there are some subtle clues, though, but that is a subject for another essay), but at times we may indeed say that we are NOT in an upleg at all. If that is the case at the moment of reading this essay, then you might consider your question answered.
![[Most Recent Charts from www.kitco.com]](http://www.kitconet.com/charts/metals/gold/t24_au_en_usoz_4.gif)

![[Most Recent Copper from www.kitco.com]](/files/idx24_copper.gif)
![[Most Recent XAU from www.kitco.com]](/files/idx24_xau_en_2.gif)
![[Most Recent HUI from www.kitco.com]](/files/idx24_hui_en_2.gif)