Precious Metals Correlations – Next Step in the Multi-market Analysis
This essay is based on the Premium Update posted on April 26th 2009
As you already know, it is usually best to analyze many markets, even if you are really interested in only few of them. After all, given today's level of globalization in the world economy and in financial markets, it is not uncommon to see most (!) markets plunge or soar at the same time. I've written about this phenomenon in the essay dedicated to gold market's fundamentals, so I don't want to repeat myself here.
Analyzing many markets already gives us advantage over most investors, who focus on gold or silver only, but I don't want to stop just there. In order to make this multi-market analysis even more efficient, I try to estimate the strength of "influence" that particular non-PM market has on gold, silver and corresponding equities. Consequently, I'm able to pay greater attention to markets that are more important at particular moment. One of the ways to measure the strength of the aforementioned "influence" is to use the linear correlation coefficient. I have put "influence" into quotation marks, because the correlation coefficient does not tell us which market influences which - still, we have the common sense to know that the price of gold determines earnings and therefore share prices of gold mining companies, not the other way around.
What this number really tells us, is "how much" have the markets moved together in the past, without telling us why this has taken place. This "correlation number" takes values from -1 to 1. If it has a negative value it means that this correlation is negative - two markets on average move in the opposite direction. If the "correlation number" is positive, then it means that these two markets move in the same direction on average.
Before I continue, I believe a technical digression is needed. I would not recommend using correlation coefficients to calculate the exact sizes of one's positions or to estimate the size of the position that one would want to hedge. Most statistical coefficients (including the one mentioned in this essay) are biased as a result of assuming normal distribution of returns. It does not pose a serious threat as long as you only use the results for comparison or to as an additional technique. One should also check the raw data for rare (but significant) events.
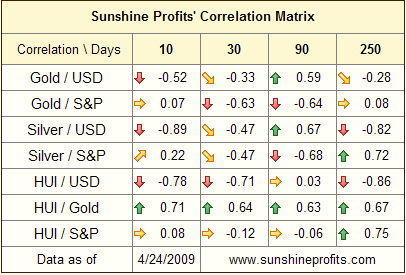
To better understand the concept of the correlation coefficient, please consider the following example. I suppose that nobody will argue with the fact that gold and silver move in the same direction on average. If we calculated the value of correlation coefficient for gold and silver it would certainly be positive. You can tell the strength of the correlation by looking how far it is from 0. For example during last year (+/- 250 trading days) gold and S&P Index have moved rather independently from each other and the correlation value is very close to 0 (it equaled 0.08 on April 24th). On the other hand, HUI Index has moved rather in tune with the price of gold, so the correlation coefficient for the previous year equaled 0.67. Please take a look at the table below.
(Update: we have improved our correlation matrix since this essay has been posted.
You can see the demo of the current version here)
I have calculated values of correlation coefficient for gold, silver and PM stocks with USD Index and the general stock market (S&P Index). I have grouped the results into columns, depending on how much data I have used to calculate a particular number. The first one has been calculated for the previous two weeks (10 trading days), whereas the last one has been calculated for the previous year (+/- 250 trading days)
The column, which one should analyze depends on what one wants to know. If you're a long-term Investor who wants to analyze the long-term trends, one should go with the last column that is created by calculating data from the previous 250 trading days (about a year). On the other hand, Day-Traders should focus on the 30-day long column or even the 10-day one (though this one is not statistically significant, but that is another matter).
The point is that not only do the prices on various markets change and should be analyzed in different time-frames, but the same applies to the way markets influence each other. The important thing here is that prices and correlations don't necessarily change at the same time. Therefore, when we see that we are getting closer to a particular turning point in gold, silver or corresponding equities, we may check what the key markets are - at that particular moment. This will tell us what might serve as a catalyst for either breakout or breakdown, which consequently increases our chances of making a correct decision. In other words, analyzing these key markets should provide us with more information about future prices and trends, than analyzing other, non-key markets.
The table above tells us several obvious things (thus indicating that this type of analysis makes sense), and several new ones. As far as the former are concerned, please note that the correlation between gold and gold stocks is always positive, meaning that gold and gold stocks tend to move in the same direction - which is obvious, and that does not add much to what we already know. On the other hand, we see several interesting points.
Gold has been lately (30- and 90-day correlation) trading rather in tune with the general stock market (naturally in the opposite direction), but it seems that gold is going to trade more independently in the future. The 10-day correlation equaled mere 0.07 which means that in the very recent past gold moved rather independently from the general stock market. As I've mentioned earlier, 10 days is not enough data to make any detailed claims, but it's enough for us to be suspicious regarding the previously prevailing correlation.
In the April 3rd Premium Update, I wrote:
It is difficult to say, when will markets stop perceiving U.S. Dollars as a safe haven, but I will monitor this situation and report to you accordingly. For now, the direct implication is that for now, signals for the USD market do not automatically translate into signals for gold/silver.
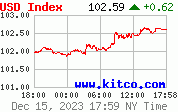
At the moment, it (once again) seems that gold is resuming its normal, negative correlation with the dollar (as measured by the USD Index). This, accompanied by already strong negative correlation USD - silver and USD - HUI, is more than enough to make me get back to my regular USD analysis. Although, this is not yet certain, not-analyzing the USD market may be costly.
Summing up, there is no strong proof yet, but it seems that the precious metals market is once again looking more at the USD Index, than at the general stock market. This does not mean that "from now on, the dollar market is all there is to the precious metals market", but it indicates that divergences between the dollar market and the precious metals market should once again be viewed as important. The general stock market is still relevant in our analysis, but we may need to look at the dollar market for more meaningful signals. Since USD Index has not broken down through its rising support trend line, the short-term trend remains up. This implies that we may (no guarantees here) see lower prices in the precious metals in the following days.
Of course the market might prove me wrong, as nobody can be right 100% of the time. To make sure that you know my thoughts (including information not mentioned here) on the market as soon as I post them, I suggest signing up for my free mailing list. Sign up today and you'll also get 7 days of access to the Premium Sections on my website (including tools and charts dedicated to PM investors and speculators). It's free and you may unregister easily.
Additionally, you will be able to see the correlation table coefficients updated on a daily basis.
This week we have implemented two new features on our website: the RSS feed mechanism and the Share/Save button.
The RSS mechanism enables you to stay up-to-date with virtually anything that we update on our website more or less regularly. We provide five separate feeds and you can sign up for as many as you would like to. The feeds are created for the following sections:
- Premium Updates
- Free commentary
- Research
- Editor answers
- Charts
As far as the last one is concerned, the feed is generated when at least one of our indicators gives any signal. If you wanted to stay up-to-date with our indicators you would have needed to check our website (the Charts section) on a daily basis, perhaps several times before our system receives the market data and transforms it. From now on, you can be notified (by RSS), whenever a new signal is given.
In order to sign up for our RSS feeds, please click the following button 
You may also find it at the right side of the page just below the "Tell your friends" button.
The second feature that I mentioned above is the Share/Save button that is visible on the bottom of most pages (including this one). This button is a super-easy and convenient way to share your favorite essays, answers (Editor answers section) or even our homepage with your friends, using e-mail, Twitter, Facebook, Digg, StumbleUpon and many other services. If you like our service, but didn't tell your friends about it yet, as it was too inconvenient - this button is a really quick way to do it. We suggest checking it out - it will only take a minute, and if your friends tell us your username when filling the registration form and become Members of the Premium Service, you'll get 3 weeks of access free of charge per each new Member that you recommended us to.
P. Radomski
![[Most Recent Charts from www.kitco.com]](http://www.kitconet.com/charts/metals/gold/t24_au_en_usoz_4.gif)

![[Most Recent Copper from www.kitco.com]](/files/idx24_copper.gif)
![[Most Recent XAU from www.kitco.com]](/files/idx24_xau_en_2.gif)
![[Most Recent HUI from www.kitco.com]](/files/idx24_hui_en_2.gif)